Women in Australia make up nearly half of the workforce, making it a significant moment in history to see the progress and advancements they have achieved. Despite the milestones reached, there are still various challenges that women in the workplace must overcome.
This article delves into the latest statistics on women in the workplace, covering a wide range of topics, such as pay inequality and job satisfaction, providing an overview of the current state of women in the Australian workforce. Get ready to be enlightened and inspired by the perseverance and determination of these amazing women.
Facts and Figures About Women in the Workplace
- In Australia, women account for nearly half (47.4%) of the labour force.
- Women employed full-time comprise over a quarter of the labour force in Australia.
- The average woman spends over five hours doing chores around the house.
- Women hold only 14.6% of Australia’s chair positions.
- The gender pay gap in Australia is 13.8%.
- Women take up to 88% of all primary caregiving leaves, while men take up to 12%.
- 23% of women have experienced sexual harassment on the job.
- 98.2 per cent of companies have an anti-discrimination or anti-harassment policy in place.
- Over 300,000 women had to dip into their superannuation accounts to get through Covid-19.
- Since 2012, there has been a 1% increase in women attending college or professional school.
How Many Women Are in The Workplace?
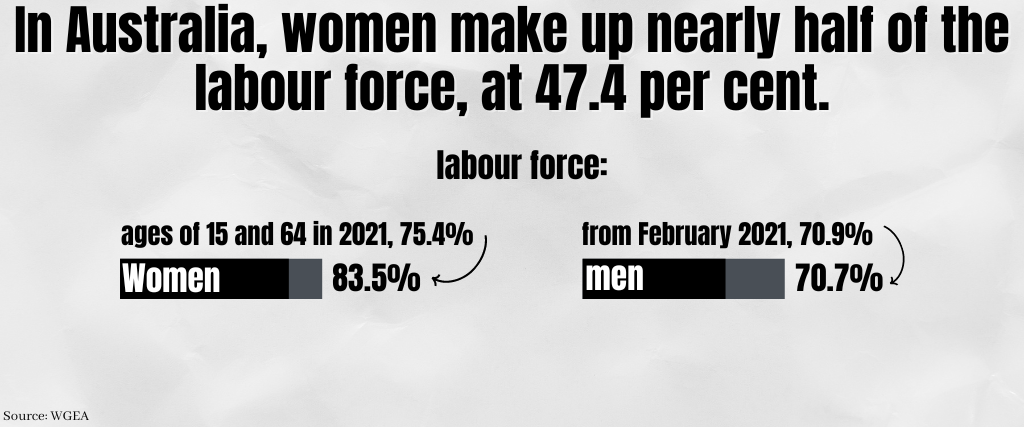
1. In Australia, women make up nearly half of the labour force, at 47.4 per cent.
(WGEA)
Women make up 61.4% of the labour force, while men make up 70.7%. This is a slight decline from February 2021, when men’s workforce participation was at 70.9%. However, there was no change in the proportion of women in the labour force.
Employment rates for men and women between the ages of 15 and 64 in 2021 show that the former is 75.4% for women and the latter is 83.5%. However, in Australia, men and women experienced an unemployment rate of 4.9% in the 2019/2020 fiscal year.
2. The employment rate for women was lowest at age 30 in 2020
(ABS)
However, women are much more likely to keep working into their later years than in previous decades. In 2020, 35.6% of women aged 65 and older were employed, which is more than three times as high as the ratio for women of the same age in the 1980s (less than 7%) and the early 2000s (10% or so).
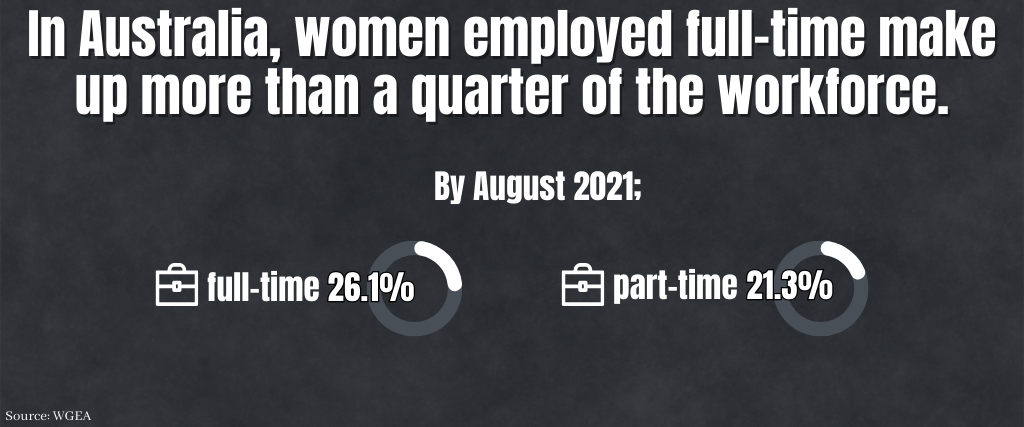
3. In Australia, women employed full-time make up more than a quarter of the workforce.
(WGEA)
By August 2021, women employed full-time made up 26.1% of Australia’s labour force, according to data compiled by the Australian Bureau of Statistics. Meanwhile, 21.3% work part-time.
Women comprise 67.6 per cent of the part-time workforce but only 38.0 per cent of the full-time workforce, according to data breaking down the workforce by gender.
4. The largest female-dominated sectors in Australia are Education & Training and Health Care & Social Assistance.
(ABS)
According to data on the gender makeup of the labour force by industry, the health care and social assistance sector (with a female employment share of 77.9%) and the education and training sector (with a female employment share of 71.6%) are the only two sectors with a female employment majority over the past two decades.
In contrast, men outnumber women by a wide margin in construction (87.3% male to 12% female) and mining (83% male to 17.5% female).
As of 2020, women made up 43% of the certified accountant workforce in Australia.
5. More than sixty per cent of women devote at least five hours per week to uncompensated indoor housework.
(ABS)
A survey conducted between May 14 and May 23, 2021, found that 62% of women spent at least five hours per week doing unpaid indoor housework, while only 35% of men did so.
Women also traditionally provided more care for others than men did. In the survey, it was found that:
- A higher proportion of women (38%) than men (28%) are primary caregivers or supervisors for children.
- Sixteen per cent of women versus seven per cent of men provide care for seniors.
- 64% of women vs 37% of men spend at least 5 hours in the kitchen.
6. In Australia, part-time workers put in 17.7 hours on average per week.
(ABS)
Statistics from the Australian Bureau of Statistics (ABS) show that the average part-time worker in 2019/2020 worked 17.7 hours per week. Full-time working women, however, put in fewer hours than their male counterparts, averaging 36.2 hours per week in contrast to 39.8 hours.
Facts and Figures on Women in Leadership Positions
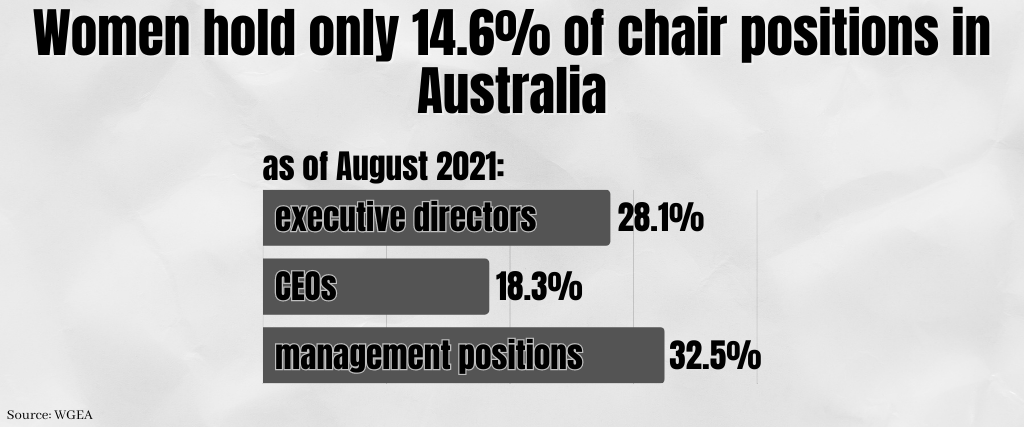
7. Women hold only 14.6% of chair positions in Australia
(WGEA)
14.6% of chairs and 28.1% of executive directors are women as of August 2021. According to the most up-to-date statistics on jobs by gender, women comprise 18.3% of all CEOs and 32.5% of management positions.
8. Only 0.4% of governing bodies and boards have zero male directors.
(WGEA)
However, up to 30.2% have no women serving on their boards of directors. And among the boards of the ASX 200 companies, women now account for a third (33.5%) of directors and nearly half (41.7%) of new board appointments.
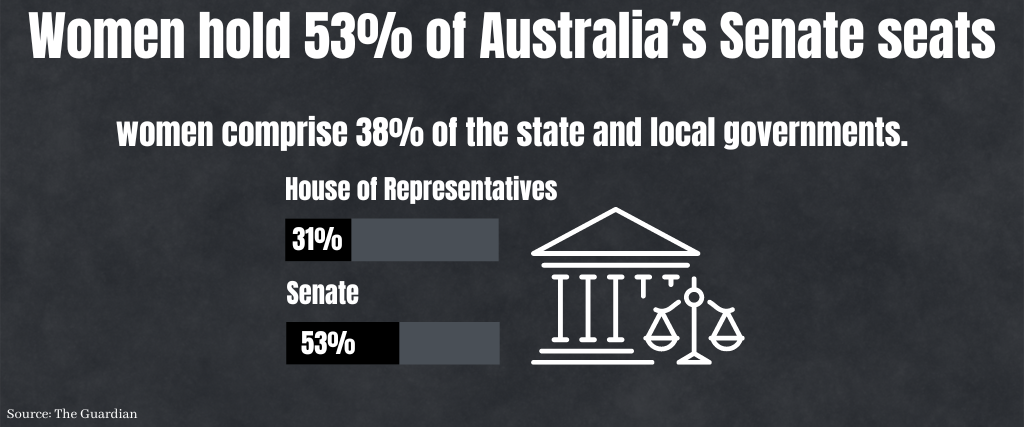
9. Women hold 53% of Australia’s Senate seats
(The Guardian)
In Australia, women comprise 38% of the state and local governments. While women make up only 31% of the House of Representatives, they make up 53% of the Senate, putting them ahead of the United States and Canada.
The Gender Pay Gap in Australia
10. The gender pay gap in Australia is 13.8%.
(World Gas Energy Association, Statista)
Australia’s gender pay gap is now 13.8%, up from 13.4% in 2020. According to data collected and analysed by Statista between May 2020 and May 2021, women earned an average of $1,591.20 per week for full-time work, while men earned an average of $1,846.50 per week.
The gender pay gap was even wider in the private sector, where women earned $986.30 per week compared to men’s $1487.90.
11. At 21.2%, Western Australia has the largest gender pay gap of any Australian state.
(WGEA)
Conversely, South Australia has the smallest gender pay gap of any Australian state at only 7.4%. Scientific, Technical, and Professional services had the highest gender pay gap (24.4%), while Other Services (3.6%) and Gas, Electricity, Waste, and Water Services (7.8%) had the lowest.
12. In 2020, the wage gap between men and women working in science, technology, engineering, and mathematics (STEM) fields was $28,994.
(DISR)
Wage and employment data by gender shows that STEM-related organisations have a significantly higher gender pay gap than other fields, at $28,994.
Also, while the percentage of women employed in all STEM-qualified industries has increased from 2016’s 24% to 2020’s 28%, STEM-qualified men are 1.8 X more likely to find employment in STEM-qualified positions than women.
General Stats of Working Women
13. Most Australian businesses have flexible work strategies and arrangement policies.
(WGEA, Deloitte)
By 2021, nearly all businesses in Australia (99%) had a flexible work strategy or arrangement, with 39.9% offering a shortened workweek and 69.1% offering flexible work hours. In addition, 66.2% of businesses let workers work remotely, and 38.0% of businesses allow purchased leave.
In addition, a recent survey found that among Australian working women, one-third say their companies have increased access to flexible working to help them adjust to the epidemic’s effect on their mental health. In contrast, 25% have established strict boundaries around working hours.
14. 12% of primary caregiver leaves are taken by men, while women take 88%
(WGEA)
According to data from 2020/21 on women in the workplace, 77.6% of businesses have policies to help workers juggle work and family responsibilities. Some 54.6 per cent offer an average of 11.9 weeks of leave for primary caregivers, while another 50.2 per cent offer 1.9 weeks on average for secondary caregivers.
Several companies provide alternatives to paid time off, such as
- Childcare reimbursements paid for by employers: 6.6%
- Provided space for breastfeeding: 68.8 per cent
- Referral Services for family support: 55%
- Workshops for mothers on parenting: 6.9%
- Workshops for fathers on parenting: 6.6%
- Back-to-work bonus: 5.8%.
Even though the government only mandates 18 weeks of unpaid leave for new parents, over half of private-sector businesses offer some form of paid parental leave. Furthermore, eighty-one per cent of companies provide superannuation benefits to parents on paid leave.
15. Only 19% of Australian women are confident that their industries have gender-diverse leadership teams.
(Deloitte)
Only one-fifth of women in the workforce believe their company’s upper echelons represent both sexes. Only 5% of employees feel that their employer is making genuine efforts to achieve gender equality, even though 13% say that their organisation regularly discusses the value of gender diversity.
Sexual Harassment of Women at Work
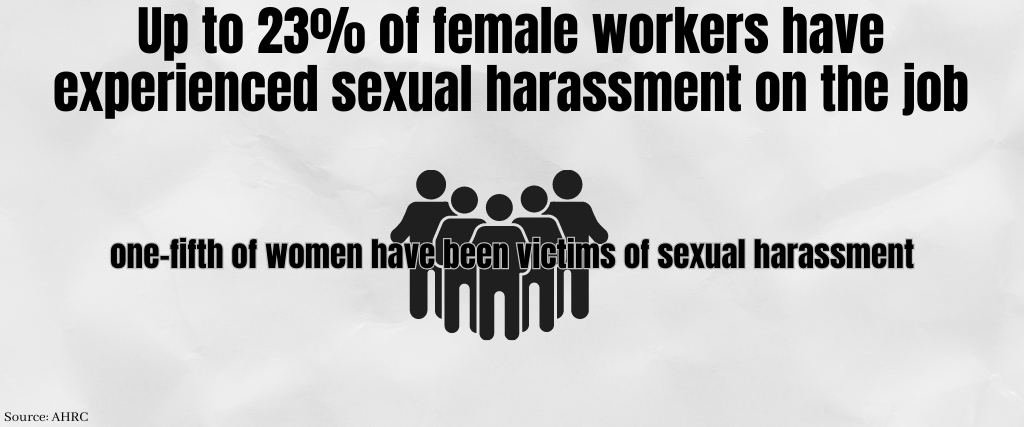
16. Up to 23% of female workers have experienced sexual harassment on the job
(AHRC)
More than one-fifth of women have been victims of sexual harassment on the job, per the Human Rights Commission’s 2018 report, compared to 16% of men.
Approximately 20% of workers between the ages of 15 and 17 have experienced sexual harassment on the job.
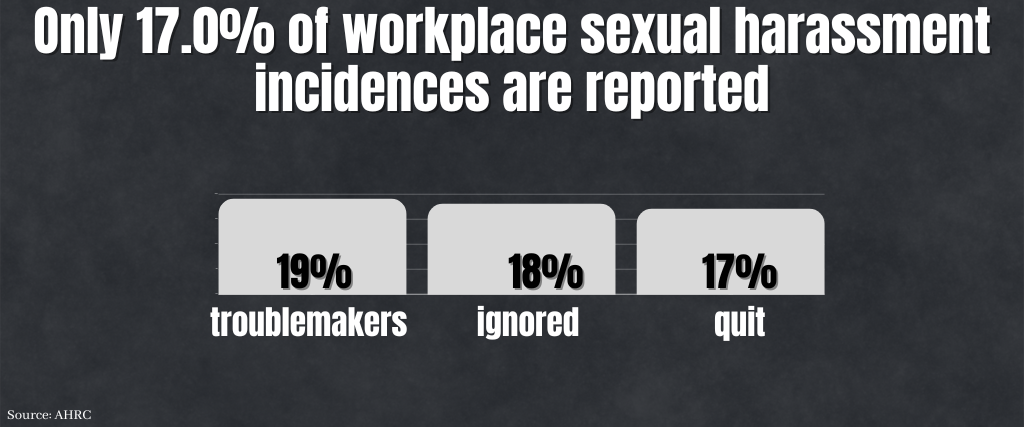
17. Only 17.0% of workplace sexual harassment incidences are reported
(AHRC)
Only about one-fifth of employees who experienced sexual harassment at work reported it. Those who did so were more likely to be viewed as troublemakers (19%), ignored (18%), or quit (17%) their jobs entirely.
18. Most Australian women, 57%, have encountered non-inclusive behaviour in the workplace.
(Deloitte)
The most common types of workplace microaggressions, according to recent information from Deloitte, are being addressed disrespectfully or unprofessionally (10%) and having your opinion doubted (11%). Women reported being given fewer speaking opportunities in meetings than men (8%), while 9% reported being demeaned by senior colleagues.
19. 98.2 per cent of organisations have the policy to combat gender-based discrimination and harassment.
(WGEA)
The WGEA also reports that 87.1% of companies provide training to their managers on how to deal with sexual harassment and discrimination and that 98.1% have a complaint procedure in place to deal with such issues.
Facts and Figures Regarding Women in the Workplace in the Wake of the COVID-19 Pandemics.
20. Over 300,000 women had to dip into their superannuation accounts to get through Covid-19.
(ACTU)
Over 1.7 million women have withdrawn $13 billion from their retirement savings accounts since April 2020. Over 300,000 women drained their accounts, putting them at higher risk of retirement poverty.
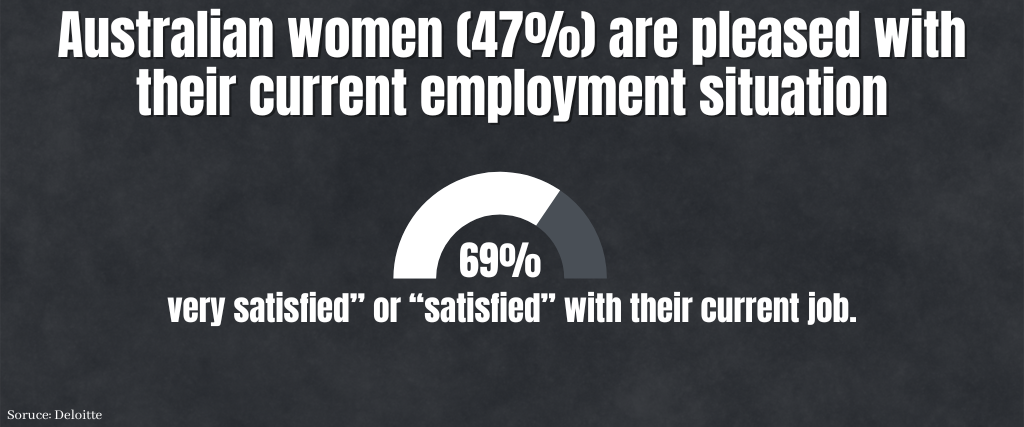
21. Australian women (47%) are pleased with their current employment situation.
(Deloitte)
Before the pandemic, 69% of women reported being “very satisfied” or “satisfied” with their current job.
22. Even before Covid-19, 57% of women held jobs with some degree of uncertainty
(ACTU)
Women are more likely than men to work in part-time, casual, and temporary jobs. They work fewer regular hours and are not eligible for benefits like paid time off for illness or retirement.
Employment insecurity is prevalent in fields where women make up most of the workforce. Statistics show that out of the total number of workers in four major industries (retail, education and training, healthcare and social assistance, and accommodation and food service), 945,000 women are employed in non-standard positions.
23. About half of Australian women (49%) are less confident in their future careers than before the pandemic
(Deloitte)
A further 23% of women contemplate leaving their current employment, with increased workload (cited by 38%) and caregiving responsibilities (27%).
In addition, 38% of women reported feeling like they weren’t making career progress as quickly as they’d like. Female workers cited mental health issues (27%), childcare duties (30%), and household duties (30%) as the primary reasons they were leaving their jobs.
Progress in Women’s Education
24. The percentage of women admitted to postsecondary institutions has increased by only 1% since 2012.
(WGEA)
In 2012, female students made up 57.9% of Australian universities’ total domestic student body. The percentage has increased slightly over the past decade to 58.9 per cent today.
In terms of levels of education, the data show that:
- A higher percentage of women (92,5%) than men (87.5%) between the ages of 20 and 24 hold a high school diploma or its equivalent.
- 48.1 per cent of women between the ages of 25 and 29 have completed a bachelor’s degree program. For men, the proportion is 36.1% of those of similar age.
25. The percentage of female college students majoring in STEM fields currently stands at 36 per cent
(DISR)
This equates to more than 81,000 women who attended universities in Australia to earn degrees in science, technology, engineering, and math. Women make up 22% of all STEM VET and university entrants and 24% of all STEM VET and university graduates.
Bottom Line
The statistics regarding women in the workplace highlight a persistent challenge in achieving gender equality in the workplace. Despite this, there is evidence of progress being made as more companies adopt policies and strategies aimed at promoting gender equality. This suggests that a more inclusive and equitable work environment for women is becoming increasingly feasible.
FAQs
1. Which is the Most Popular Occupation for Women in Australia?
According to the Australian Bureau of Statistics (ABS), in 2018-2019, women held 76.3% of all administrative and clerical positions, making this the most common field for women to work in. In contrast, men accounted for nearly nine out of ten positions in the construction equipment industry (88.8%).
2. In 2021, what proportion of the American labour force was composed of women?
(Statista)
In 2021, women only comprised 53.2% of the labour force in the United States, down significantly from their historic high of 57.5% in 2000.
3. In 2020, what proportion of the UK labour force was composed of women?
(GOV.UK)
Statistics on women in the workplace show that from December 2019 to February 2020, women made up 72.7% of the workforce in the United Kingdom.