Ten years ago, only A-listers and a handful of serious bloggers could be considered “influencers” in the marketing world. In recent years, however, this marketing niche has enjoyed a meteoric rise, market saturation, and even fraud involving social media.
Suppose you have done any prior study on influencer marketing. In that case, you may have come across contrasting opinions, such as the assertion that you either need to or may safely ignore the asocial influencers’ advice when doing your business.
There has never been a more perplexing time for brands to find their way around influencer marketing methods. Luckily, this post has developed a guide to help Australians get their bearings.
Find out if influencer marketing is right for your business with this resourceful piece.
Statistics on Influencer Marketing in Australia
1. There Are 5 Categories of Social Media Influencers in Australia
- Data by Hype-Journal
Influencers can be categorised into the following categories according to the number of followers they have:
- nano-influencers — 1000 to 5000 followers
- micro-influencers — 5000 to 20,000 followers
- mid-tier influences — 20,000 to 100,0000 followers
- macro-influencers — 100,000 to 1 million followers
- Mega-influencers — a million and more followers
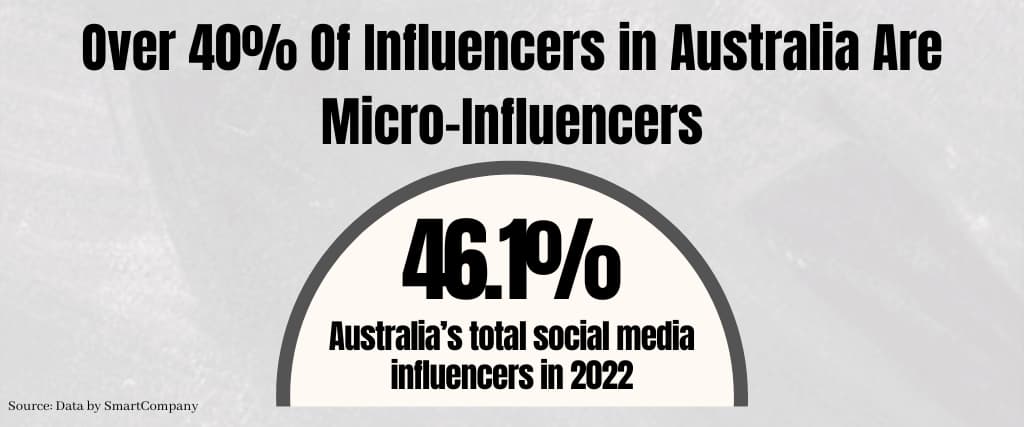
2. Over 40% Of Influencers in Australia Are Micro-Influencers
- Data by SmartCompany
Micro-influencers make up the vast bulk of Australia’s influential people. They represented 46.1% of Australia’s total social media influencers in 2022.
3. 80% Of Australians Are Active on Social Media.
- Data by Genroe
Most Australians (79.9%) had active social media profiles by 2022. The numbers are expected to hit 90% by 2025. For those between the ages of 16 and 64, 18.2% said they often follow internet gurus and influencers.
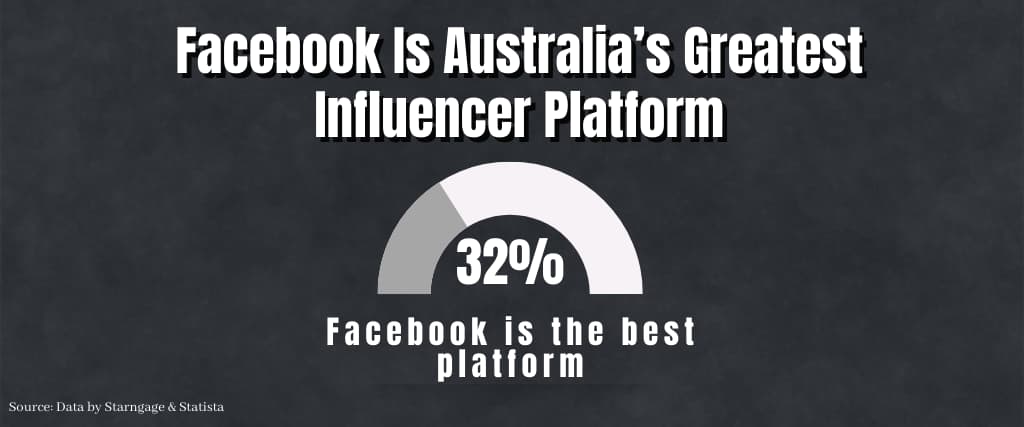
4. Facebook Is Australia’s Greatest Influencer Platform
- Data by Starngage & Statista
In a recent survey of Australian social media influencers already working with companies, 32% said Facebook is the best platform.
5. Nano-Influencer Engagement Exceeds 4%
- Data by SmartCompany
The percentage of Aussies who are influential on social media is higher than the worldwide average, according to research from 2022. The average interaction rate of nano-influencers is 4.51%, making them the leaders in this metric.
The average engagement level is 2.01%, whereas macro-influencers are only 1.53%. Compared to the worldwide average of 1.36%, the social media engagement of Australian mega-influencers is slightly better at 2.22%.
6. Big and Small Firms Use Influencer Marketing to Gain Customers
- Data by Power Digital Marketing & Engaiodigital
The use of influencers has benefited both large and small companies by increasing their exposure and consumer base. Businesses as diverse as real estate firms, health insurance providers, television networks, beverage manufacturers, and tourist boards have all reaped the rewards of influencer marketing.
7. YouTube and Instagram Videos Are Influencers’ Most Popular Formats
- Data by Big Commerce
In 2019, Instagram posts outperformed Instagram stories regarding influencer marketing efficacy (78% to 73%). Next are video-sharing platforms like YouTube (56%) and Instagram (54%). The percentage of users that watch content on Twitch Livestream is the lowest of any medium.
Australian Influencer Statistics
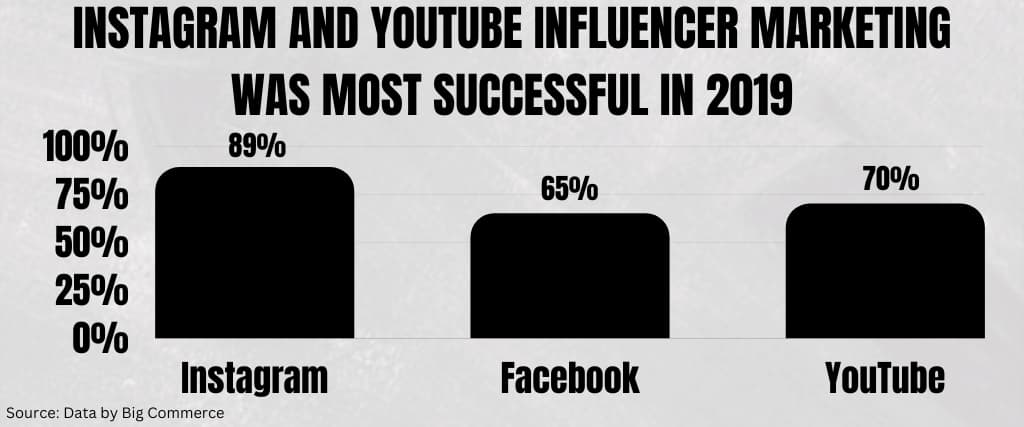
8. Instagram and YouTube Influencer Marketing Was Most Successful in 2019
- Data by Big Commerce
Instagram was the most popular social media platform among influencers, utilised by 89% of them. Facebook is in first position with 65%, followed by YouTube with 70%.
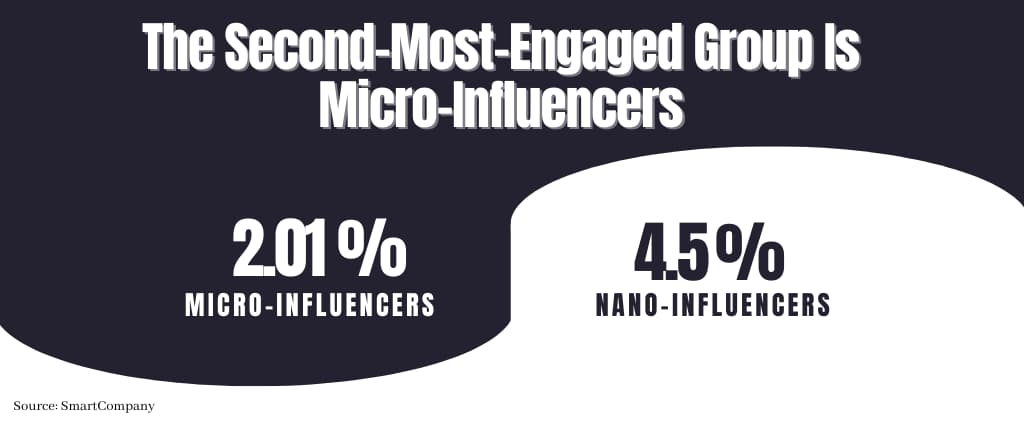
9. The Second-Most-Engaged Group Is Micro-Influencers
- Data by SmartCompany
With an average engagement rate of 2.01%, micro-influencers are in a respectable second place among influencers. This lagged far behind compared to nano-influencers (average 4.5% engagement).
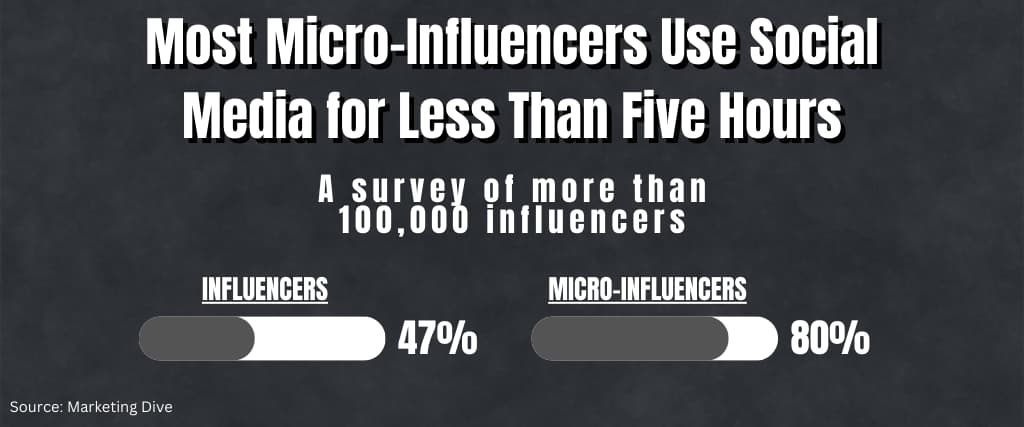
10. Most Micro-Influencers Use Social Media for Less Than Five Hours
- Data by Marketing Dive
A survey of more than 100,000 influencers found that 47% of influencers spent more than five hours per day influencing, and 80% of micro-influencers spent at least three hours on social media.
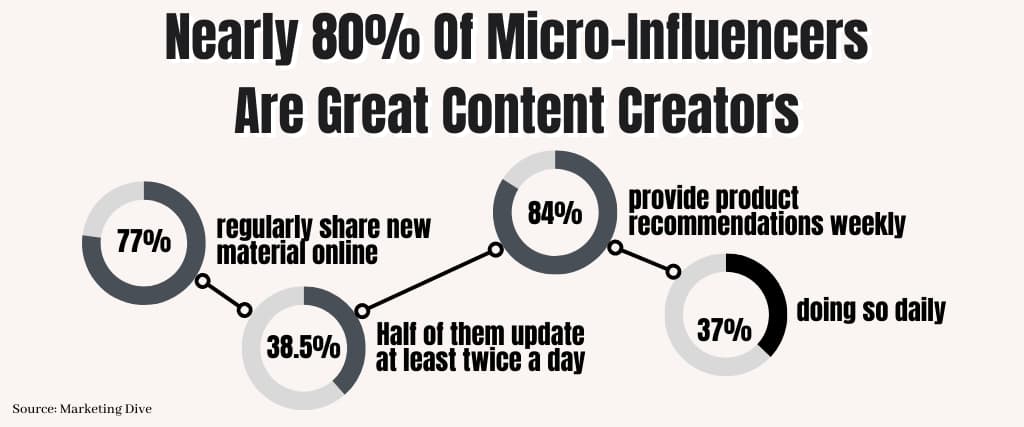
11. Nearly 80% Of Micro-Influencers Are Great Content Creators
-data by Marketing Dive
The same survey also found that 77% of micro-influencers regularly share new material online. Half of them update at least twice a day. At least 84% of them provide product recommendations weekly, with 37% doing so daily.
Revenue and Expense of Influencer Marketing
12. Influencer-Generated Content Costs Businesses Over Us$100
- Data by Forbes & Influencer Marketing Hub
Advertisers often pay influencers $174 for every promotional post they make. Given that the brand’s investment in the influencer sector is likely to grow, this figure might climb as well. It is predicted that by 2022, brands will have spent a total of $15 billion on influencer marketing.
13. Micro-Influencers in Australia Can Make $200 per Post
- Data by SmartCompany
Most Instagram influencers are micro-influencers, who may earn anything from AUD 20 to AUD 200 for each post. Of course, the critical variable here is how actively they are participating.
14. Micro-Influencers Receive More Than Cash
- Data by Impact.com
Micro-influencers may make much money with sponsored posts on feeds; the payment depends on the content niche or the product being reviewed.
15. Over 60% Of Cosmetics and Fashion Businesses Use Influencer Marketing
- Data by Starngage & Social Law Co
Over 21% of fashion and beauty companies will put money into an influencer marketing strategy. Spell & The Gypsy, Lahana Swim, Eco Tan, Bondiboost, Culture Kings, Happy Way, and many more are a few big Australian brands that collaborate with micro-influencers.
Demographics Stats of Influencers
16. Nearly 85% Of Influencers Are Female
- Data by Statista
A 2019 study found that women constituted 84% of Instagram influencers that generated sponsored content on the platform.
17. One-Third of Leaders in the Industry Are Under the Age of 25
- Data by Statista
Another 2019 survey found that among influencers who created sponsored posts, 31% were between 18 and 24. Meanwhile, 54% were between the ages of 25 and 34, and 11% were between the ages of 35 and 49.
The Impact of Micro-Influencers on Customers
18. Many Customers Trust Micro-Influencers Above Macro-Influencers
- Data by Inbeat agency
Micro-influencers are much easier to connect with and trust. Micro-influencers have a tight-knit community since their material is genuine and unique, leading to open dialogue among their followers.
19. Influencers Drove Over 50% Of Purchases
- Data by Digital Marketing Institute
About half of the customers trust recommendations from influencers, and almost as many (49%) have made a purchase based on an influencer’s post on Twitter, Instagram, or YouTube.
20. Young Adults Are More Inclined to Buy From Influencers
- Data by Influenceonline
Influencers are particularly effective in persuading consumers aged 15 to 21 to purchase. They are receptive to material from influencers, making them a lucrative demographic to reach.
21. Influencers Influence Almost 80% Of Women in Purchasing
- Data by Marketing Institute
Over half of all women who follow influencers do so to get shopping tips, and another study found that those who did so were more likely to make a purchase.
22. Influencer Fraud Was Over 50% In 2022
- Data by Statista
Many Instagram stars with over a million followers engaged in questionable practices to artificially inflate their audience size and popularity. In 2022, about 55.39% of all influencers were scammers.
Australian Micro-Influencers Are on the Rise
23. Micro-Influencers Are Growing in Popularity
- Data by Influence Marketing Hub
The market for micro-influencers expanded even more throughout 2022. They increased their market share from 89% in 2022 to 91% in 2022, and the trend has continued. Micro-influencers are more genuine and trustworthy; thus, it stands to reason that more niche markets would want to collaborate with them.
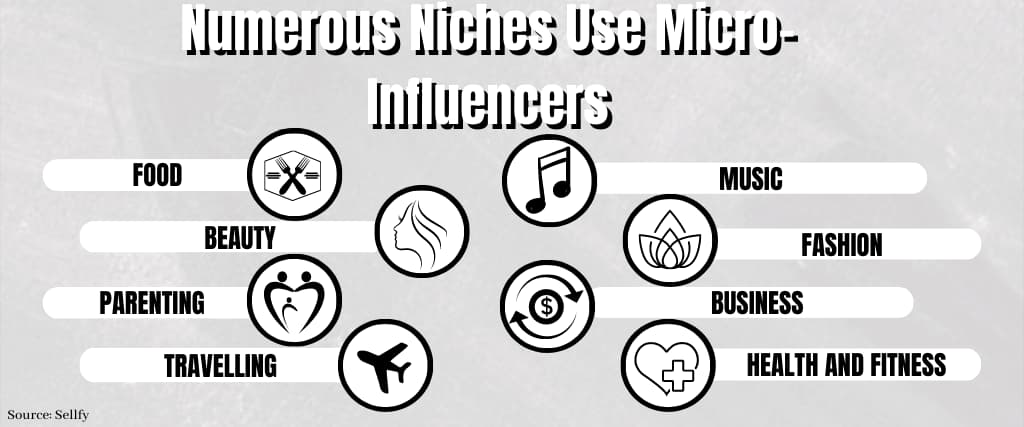
24. Numerous Niches Use Micro-Influencers
- Data by Sellfy
Micro-influencers were particularly prominent in the following niches in the year 2022:
- Food
- Music
- Beauty
- Fashion
- Parenting
- Business
- Travelling
- Health and Fitness
25. The COVID Pandemic Bred Micro-Influencers
- Data by Hurrdat Marketing
During the pandemic of 2022, many companies have resorted to digital content makers and social media influencers for advertising. Therefore, the market for influencer marketing expanded in Australia, and the percentage of the market held by micro-influencers increased dramatically.
Bottom line
The use of micro-influencers in marketing has exploded during the last several years. These Australian influencer marketing data help illustrate how the industry has evolved and why that’s significant.