Some people prefer renting because of the freedom from having to pay a mortgage, but others value the stability that comes with owning their place. You clearly know the best option, but what about your fellow Aussies?
Discover the most up-to-date information on the Australian housing market, the makeup of first-time buyers, the locations charging the most and the least for rent etc
Let’s dive in!
10 Important Aspects of Australia’s Housing Market
- More than $9 trillion is at stake in Australia’s real estate market.
- Mortgaged or not, 66% of f households are homeowners.
- Twenty-five per cent of Australians owns at least one residential property besides their primary residence.
- Nearly half of the 30–34-year-old demographic are homeowners.
- One-third of the market is made up of first-time homeowners.
- The average weekly rent in Sydney is $580, the highest in the world.
- The $1.3 million median value of a home in Sydney is the highest in Australia.
- Seventy-five per cent of households spent no more than a quarter of their total income on housing.
- An average family spends $317 per week on housing.
- The standard rental charge on a home increased in 2022 by 1%.
Australian Housing Characteristics
1. The value of the Australian real estate market exceeds $ 9 trillion.
House prices in Australia fell by $18,900 in 2022, the first decline in the market in two years. Residential property is now worth $9,983,4 trillion, a drop of $162.4bn from its March 2022 peak of $10,145,8 trillion.
2. Single-family detached homes are Australia’s most common type of housing.
Younger people, who typically rent rather than buy, are the most likely to live in higher-populated dwellings, while families prefer larger, more detached houses. The most recent statistics on housing in Australia show that detached houses are home to almost 7 million Australian households, which is nearly three times as many as medium and high-density apartments combined.
3. There are now only 2.6 people in the average home.
According to the Australian Institute of Family Studies (AIFS), nearly one in four homes consists of a single occupant. This has decreased the average number of people living in single-family homes from about 3.6 to 2.6 in the last fifty years.
Since the typical Australian home is around 242 square meters or an equivalent of a three-bedroom house, this information comes as a surprise. In 2019 and 2020, first-time buyers made up 35% of the market. The proportion of first-time buyers is often used as a proxy for the accessibility and health of housing markets.
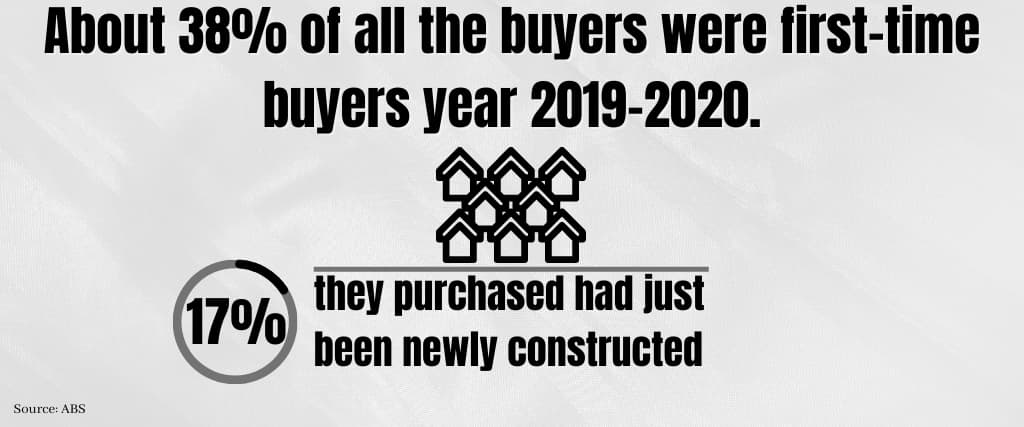
4. About 38% of all the buyers were first-time buyers year 2019-2020.
These people seemed promising to buy flats or apartments, as indicated by data from the ABS. Seventeen per cent of the homes and apartments they purchased had just been newly constructed.
5. Approximately 20% of Australians own investment properties in the residential sector, but only 20% own property outside of their primary residence
2.02 million Australian households in 2019-2020 owned a second home, according to the country’s official housing statistics. Sixty-eight per cent of those people owned only one home, while four per cent owned five or more.
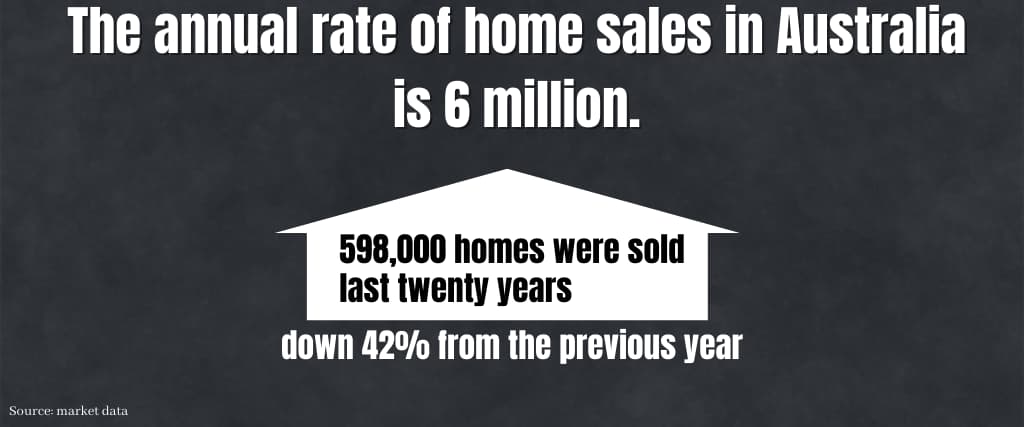
6. The annual rate of home sales in Australia is 6 million.
According to market data, home sales have been almost at an all-time high for the last twenty years. About 598,000 homes were sold that year, down 42% from the previous year.
7. When it comes to mortgages, CommBank is far and away the industry leader.
CBA has the largest mortgage loan portfolio in Australia, at nearly $5.5 trillion, followed by Westpac Banking. The debt carried by Australian families totals 119.30 per cent of the country’s GDP. Over the past 30 years, Australia’s average household debt has increased. The top ten lenders controlled 91% of the mortgage market by 2020.
Tenancy data for Australia
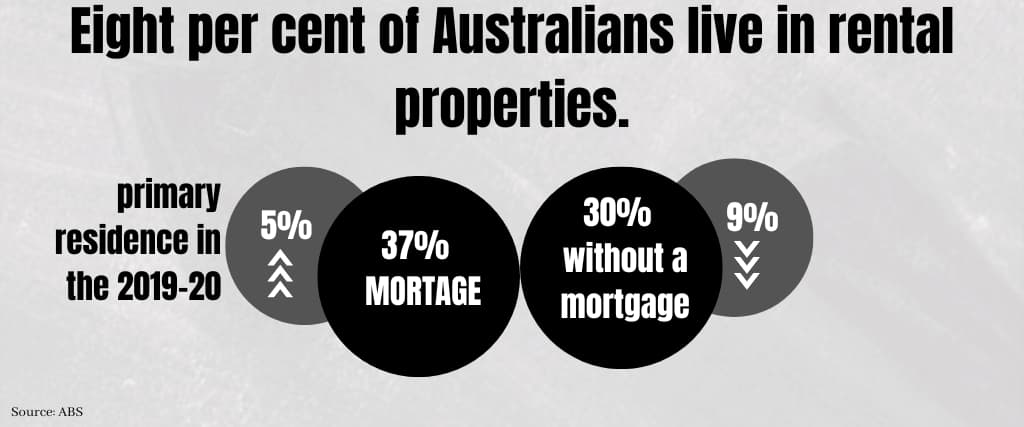
8. Eight per cent of Australians live in rental properties.
According to the ABS, 37% of Australian households had a mortgage on their primary residence in the 2019-20 financial year, while 30% of residences were purchased without a mortgage. These numbers have increased by 5% and decreased by 9% over the past two decades.
9. The percentage of Australians who own their own homes is falling.
According to the data census on housing in 2021, 67.5% of all of Australia’s private dwellings were inhabited by owners. This was down from 70.6% in 1999-2000. It suggests that the proportion of Australian households who own their homes has decreased overall, but the decline has been more pronounced for certain demographics, including young, low-income households.
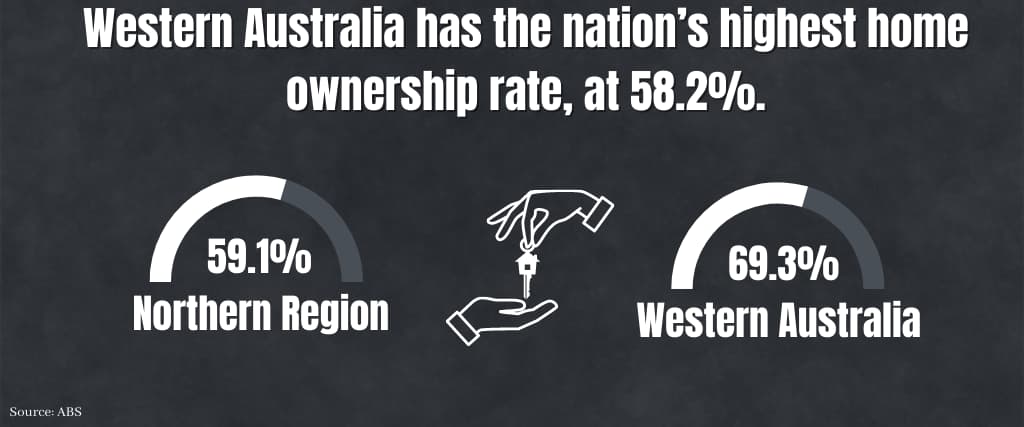
10. Western Australia has the nation’s highest home ownership rate, at 58.2%.
ABS reports that homeownership rates range from 59.1% in the Northern Region to 69.3% in Western Australia. The average cost of a home in each territory likely plays a role in the disparities across Australia’s housing market.
11. Approximately 50% of Australians in their 30s and early 40s own homes.
Only 36.1 per cent of the population aged 20-29 years are homeowners, with the vast majority instead opting to rent. Roughly 50 years ago, this percentage was likely closer to 50%.
Almost two-thirds of Australians are homeowners by the time they reach their forties, and that proportion rises to 73.4% among those aged 50 to 54. The 1930s marked a watershed decade for home ownership in Australia.
12. Around one-third of all households in Australia are renters.
Over the past two decades, there has been a 4% increase in the percentage of Australians renting homes. This brings the total to 31% of the population. More specifically, 26 per cent of all households in Australia now rent from private landlords (up by 6%), while only 3 per cent now rent from state or territory government agencies (down by 3%).
13. More than half of Australians under 35 are renters.
Younger Australian families have been hit harder by the rise in private-landlord renting than older families have been. The AIHW report on renting reveals that younger generations (60.1%) are more likely to rent from private landlords than older generations (20.6% vs. 0.0%).
Whereas private landlords are not prohibited from raising rent by law, increases of more than 10% to 20% (this varies by state) are typically viewed as unreasonable by government agencies.
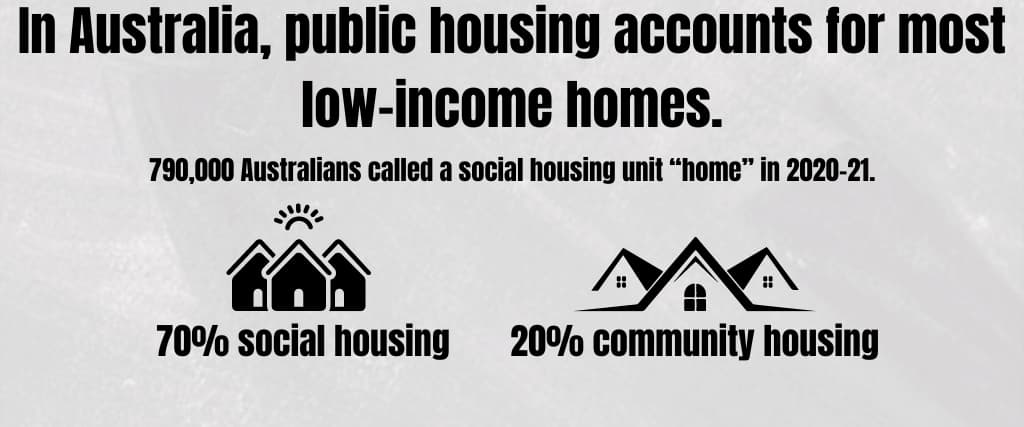
14. In Australia, public housing accounts for most low-income homes.
Research from a study shows that 790,000 Australians called a social housing unit “home” in 2020-21. Seventy per cent of those units were social housing, while the remaining twenty-four per cent were community housing.
15. New South Wales has the highest concentration of social housing units in the country
Based on the most up-to-date data from the Australian Bureau of Statistics, New South Wales is home to 106,347 social home residences, including 96,729 public housing dwellings and 53,233 social housing dwellings.
16. Half of all low-income housing units in Australia are apartments or flats.
In 2021, nearly an even split existed between the different types of public housing in Australia: 37% were single-family homes, 35% were apartments or flats, and 27% were townhouses with attached garages. According to reports by AIHW, apartments or flats make up 51% of all community housing, with single-family homes coming in at a distant second at 30%.
Affordability and Price of Housing
17. In 2021, the median Australian household spent 131.5% of its annual income on housing.
A 41.5 percentage point increase is projected between 2010 to 2021 for the ratio between OECD’s price and income in Australia. The price-to-income ratio peaked in 202 and hit its decade-low of 83.6% in 2012
18. Seventy-five per cent of homes spent at most twenty-five per cent of their gross earnings on housing.
In Australia, as elsewhere, the ratio of housing costs to household income is used to measure housing affordability. The Australian Bureau of Statistics found that in 2019-20, 5.5% of families were vulnerable, having spent half or more of their total income on rental income, while 11.5% used between 30% and 50%.
However, between 57 and 69% of Aussies report spending the vast majority of their earnings on food, making it one of the country’s most significant outlays of cash.
19. Average weekly rental prices in Australia were $317 in 2022, according to a survey of Australian households.
Depending on the length of your lease and the type of landlord you have, your average weekly rental income can range widely. Average weekly housing costs in Australia for 2019-20 were $493 for mortgaged homeowners, $379 for tenants, and $54 for mortgage-free homeowners.
20. Home pricing in Australia
Sydney, Australia, has the highest annual home value in Australia at $1.177.700 million, June 2022. It’s nearly 50% greater than the average in the country! Aus
Australian Capital Territory has the second highest home values in Australia, behind only Victoria. Northern Territory has the world’s cheapest average home price at just $542,100.
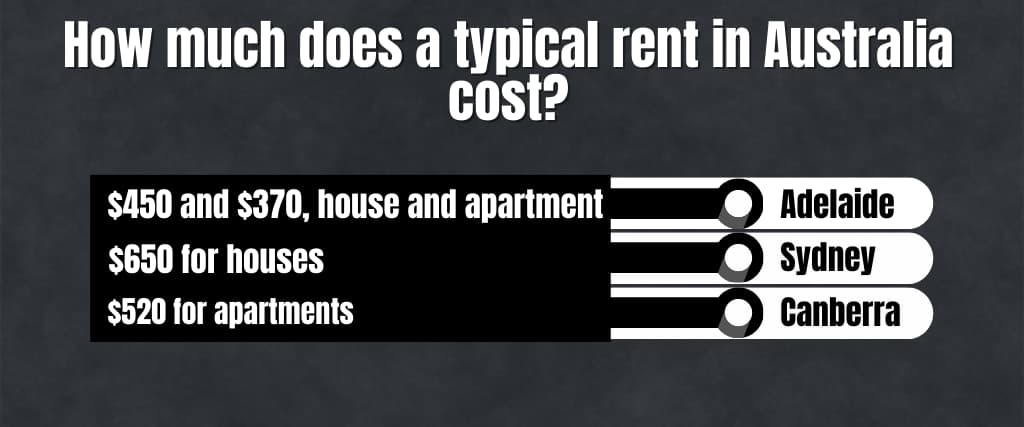
21. How much does a typical rent in Australia cost?
Adelaide has the lowest median weekly house and apartment leases in Australia, at $450 and $370, respectively. Sydney has the highest weekly rent in Australia at $650 for houses, while Canberra has the lowest at $520 for apartments.
Evidence of the Australian Property Market
22. Half of all first-time buyers were between the ages of 25 and 34.
According to data from the Australian Bureau of Statistics, about 423,700 people bought their first home in 2019-2020. About 56.1 per cent of them fell in the 25-34-year-old category. 25.6 per cent were between 35 and 44, and 9.7 per cent were between 45 and 54.
23. Regional SA had the highest rate of annual growth in home values
When comparing capital city and regional home value appreciation rates in 2022, South Australia (SA) had the highest at 22 per cent, while Sydney (NSW) had the lowest at -6 per cent. However, some of Australia’s cheapest real estate is in South Australia.
24. According to the 24th statistic, over 115,000 Australians are currently experiencing homelessness
Welfare statistics estimate that in 2015–16, approximately 116,000 people in Australia were homeless. One-fifth were those between the ages of 25 and 34, and three-fifths were male.
According to the Human Rights Commission’s survey, one in two hundred Australians do not have a safe place to sleep; one-third of these are children and young people under 18.
25. Eighty per cent of retirees in Australia favour remaining in their own homes.
(AgedCareRoyalCommission)
Over two-thirds (68%) of Australians hope to be able to stay in their own homes even if they eventually require some sort of care. Twelve per cent want to downsize to a smaller home, and seven per cent want to move closer to loved ones to be closer to informal care and support. Of the 335,889 Australians over 65, only 25% would choose to live in a retirement community.
Projections for the Future of Housing in Australia, Year
26. House prices in Australia increased by 1% on average in 2022.
Data from Australia’s real estate market shows that while home prices fell during the early stages of the pandemic, people’s desire to invest in tangible assets quickly revived demand for housing.
The national average for annual home price growth is estimated to be 10.3%, which is a whopping 30.8% in three years.
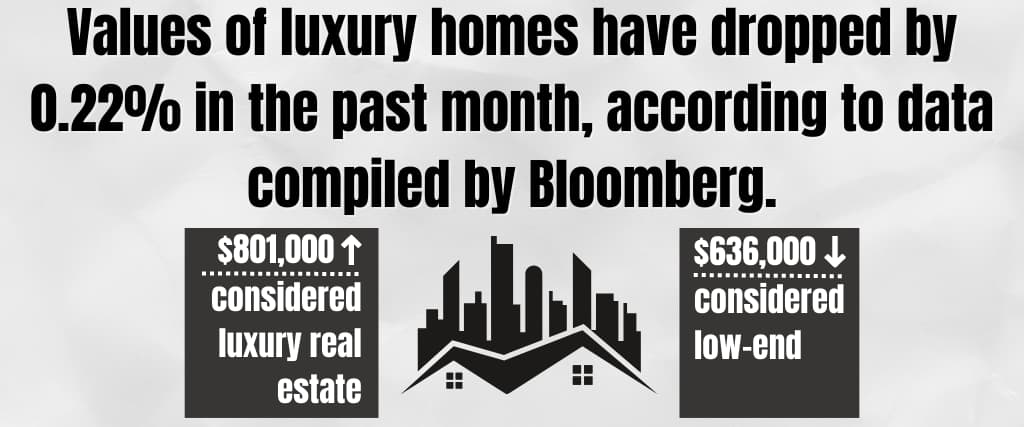
27. Values of luxury homes have dropped by 0.22% in the past month, according to data compiled by Bloomberg.
Properties in capital cities with a median price value of more than $801,000 are considered luxury real estate, while those valued less than $636,000 are considered low-end. The high end of the Australian real estate market is driving the market’s expansion overall, as evidenced by the relentless expansion of the upper end of the latter segment.
Conclusion
The housing sector is set for growth after enduring a difficult pandemic period. Most Australians may be interested in a house upgrade, which could rapidly increase asking prices once demand increases. The mandate to work from home during the pandemic, on the other hand, freed up the housing market in the suburbs and regional towns, attracting tenants and homeowners from the overcrowded cities.
With any luck, this survey of Australia’s housing market data will help you make sense of the current climate for buying and selling property in the land down under.