The criminal justice system in Australia deals with adults who have committed or are suspected of having committed a crime.
Australia has nine distinct legal frameworks, one for every state and the federal government. Because of these divisions, each state and territory has laws, sanctions, and methods for delivering justice (ABS, 1997).
With this well-structured judiciary system, all Aussies can rest assured that the government protects their safety. However, there are still a few criminal cases happening in Australia.
This article has compiled some crime stats for you to use in assessing the actual crime rates nationwide so that you can rest easy.
Let’s investigate it!
General Crime Data in Australia
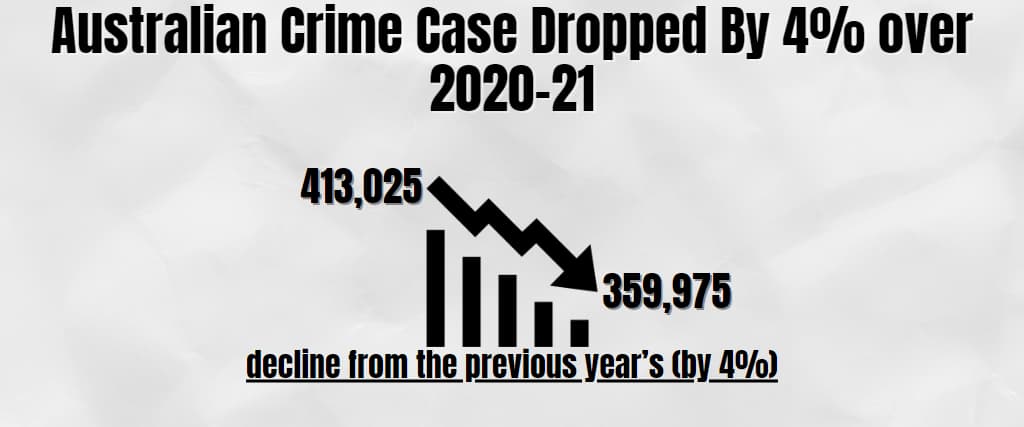
1. Australian Crime Case Dropped By 4% over 2020-21
The latest up-to-date ABS crime figures show Australia is getting safer over time. In 2020-21, the Australian police department prosecuted 359,975 criminals, a considerable decline from the previous year’s 413,025 prosecutions (by 4%).
2. The Australian Offender Rate Was 1,599 Criminals per 100,000 Aussies; In 2020/21
The number of offenders per 100,000 people declined by 78 from 2020 to 2021. The figure dropped to its lowest level since 2008–2009.
3. Public Order Offenses Dropped 59% From 2020 to 2021
The Australian official crime data show that public order criminals dropped from 40,975 in 2019/20 to 38,151 in 2020/21, a fall of 2,824. In Queensland, offenders decreased by 14%, or 12,170. In Tasmania, South Australia, and South Australia, offenders decreased by 26%, or 2,392, and by 59%, or 163.
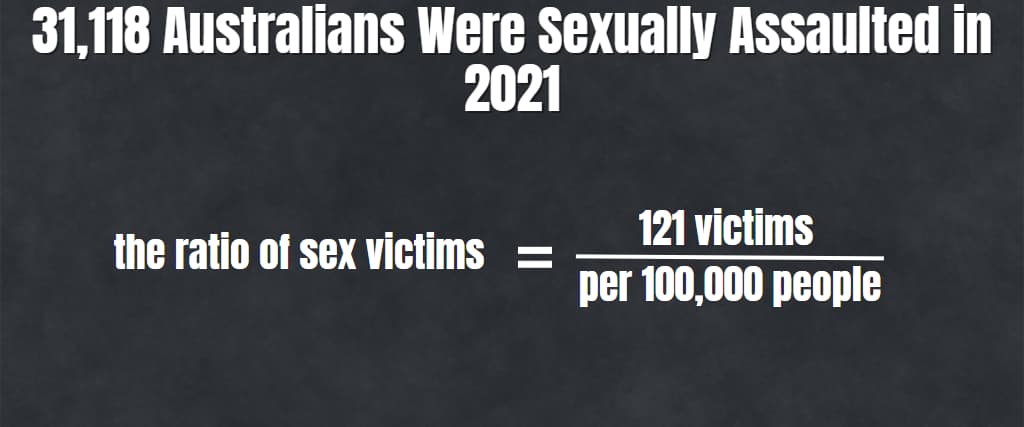
4. 31,118 Australians Were Sexually Assaulted in 2021
According to data on sex abuse in Australia, the victim count is expected to reach a record high in 2021, surpassing the previous peak set in 1993. In 2021, the ratio of sex victims was 121 victims per 100,000 people.
5. In 2020–21, Aboriginal Offenders Committed The Most Injury-Related Crimes
According to preliminary data on criminal activity in Australia broken down by ethnicity for 2019/20, the following is the number of Aboriginal Strait Islander criminals who were convicted by police in each territory and state:
- Australian Capital Territory—372
- South Australia—4,036
- Northern Territory—4,990
- NSW —15,052
- Queensland—17,564
6. In 2020/21, 29,218 Australians committed Covid Offences.
Several global pandemics have been identified as contributing causes to crime patterns. In particular, in 2020-21, there were 12,856 criminals whose crimes were associated with Covid-19. 79% of these criminals live in Victoria, as shown by recently released coronavirus statistics.
Far fewer criminals attempted at least one offence related to the epidemic in other areas:
- Australian Capital Territory: 18
- Northern Territory: 100
- West Australia: 746
- Tasmania: 114
- South Australia: 2,077
- New South Wales: 2,357
- Queensland: 694
Impressively, no crimes were committed in response to the outbreak throughout that fiscal year in the Capital Territory.
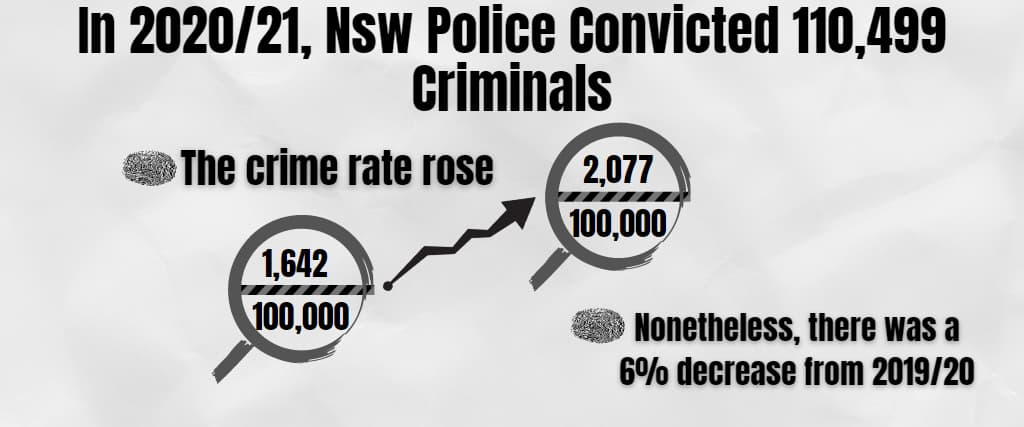
7. In 2020/21, Nsw Police Convicted 110,499 Criminals
The crime rates in NSW are the greatest in Australia, based on the figures that break down the states. Nonetheless, there was a 6% decrease from 2019/20, when authorities prosecuted 116,924 offenders in NSW, to 2020/21. The crime rate rose from 1,642 per 100,000 people to 2,077.
8. In 2019/20, Victoria’s Crime Rate Increased by 6%.
The most recent data for 2022 show that the crime index in Melbourne is 44.41 out of 100, while Victoria has a 45.62 crime index.
Police in Victoria prosecuted 78.554 criminals in 2020/21, a 6% rise from 2019/20. The criminal rate was 1,272 per 100,000 people in 2019/20 and 1,343 per 100,000 in 2020/21.
Various crimes (25% of all primary crimes committed in Victoria in 2020–21) accounted for 19,692 criminals and 16,526 of these non-court proceedings due to penalties issued for COVID–19-related violations.
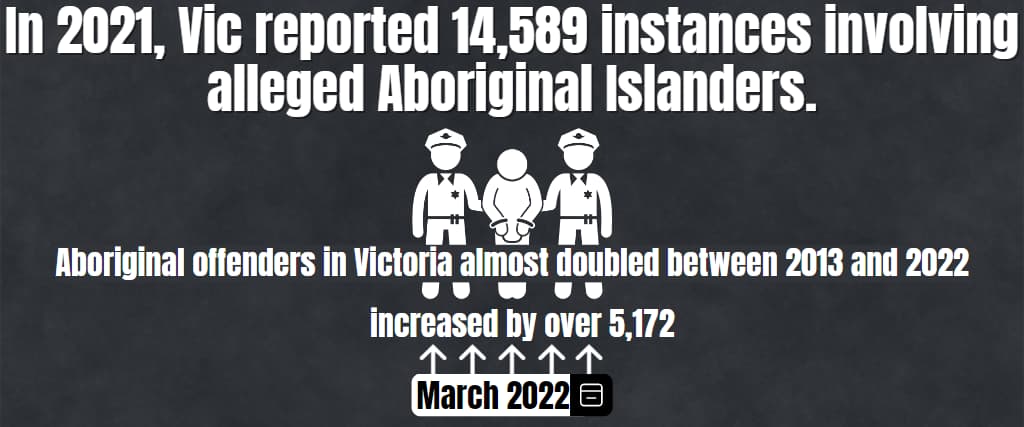
9. In 2021, Vic reported 14,589 instances involving alleged Aboriginal Islanders.
According to a breakdown of crime statistics by race, the number of occurrences involving suspected Aboriginal offenders in Victoria almost doubled between 2013 and 2022. The figure was 8,201 in 2013; by March 2022, it had increased by over 5,172.
10. Police in Queensland Convicted 84,389 Criminals in 2020–21
The number of criminal offences per 100,000 people in Queensland declined from 1,975 in 2019/2020 to 1,857 in 2021.
In the same time frame, there was also a dramatic drop in public prostitute offenders, down by 8.7% to only Six offenders, the lowest number ever. Various infractions declined more than threefold, reaching 68 criminals, while alcohol-related and breach offences increased by 18,4% and 17,1%, respectively, to reach 544 violators and 5,836.
Ten thousand three hundred fourteen persons were apprehended for drug-related offences in the Australian state of Qld in 2020–2021, which accounted for 13% of all crimes.
11. In 2020–21, South Australia Had 1,995 Criminals per 100,000 Aussies.
According to the comprehensive Australian crime data by the government, the SA police prosecuted 31,272 criminals in 2020–21, which is 15% less than the preceding year.
In 2020–21, 9,426 criminals were engaged in principal offences related to illicit drugs, which comprised 30% of the cases and were the most frequently tried crime in the state.
From 2019–2020 and 2020–2021, other offences grew by 59% throughout the year, mainly because of penalties imposed during COVID-19, while crimes involving fare evasion decreased by 87%.
In addition, as of 2022, Adelaide, the capital of SA, has a meagre crime rate. The safety score is 81.75, whilst the crime rate is 27.24 out of 100.
12. In 2020–21, Western Australia Recorded the Lowest-Ever Crime Rate of 1,526 Criminal Offences per 100,000 Residents
Police in Western Australia prosecuted 35,468 criminals in 2020/21, 6% fewer than in 2019–20. Moreover, from 1,526 criminals per 100,000 persons in 2020–21, the criminal rate fell by 112 in that same period.
The exact crime figures show that in WA in 2020/21, 7,251 criminals, or 20% of all criminal offences, involved illegal drugs, with 5,103 of those charged with possessing or using—the most prevalent offence in this state. Furthermore, from 2019/20 to 2020/21, fraud and deception fell by 29%. One thousand twenty-three more people committed various offences.
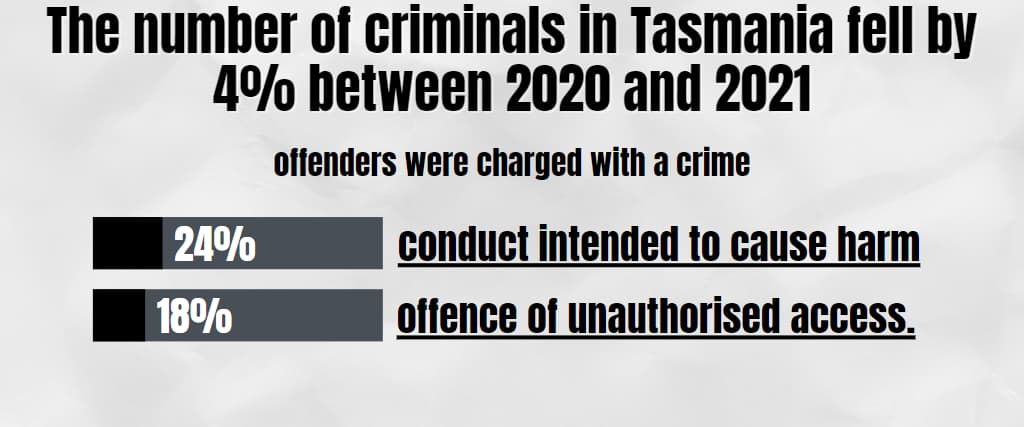
13. The number of criminals in Tasmania fell by 4% between 2020 and 2021
There were 8,389 criminal defendants in Tasmania in 2020–21. According to Australia’s official crime data, the country’s crime rate per 1000 persons was 1,826 in 2020 before falling to 1,744 the following year.
In 2021, 24% of offenders were charged with a crime due to their primary conduct intended to cause harm, while 18% were accused of a crime due to their primary offence of unauthorised access.
14. 9,181 Criminal Defendants Who Were Prosecuted Resided in the Northern Territory in 2020–21.
The NT had 3% fewer criminals than the previous year, according to Australia’s 2020/21 crime map. Acts intended to inflict harm accounted for 34% of all major crimes perpetrated in this territory (3,160 offenders), while 2,392 Aussies committed public order offences, a 19% rise over the previous year.
15. The ACT police prosecuted 2,222 criminals in 2020–2021.
The Capital Territory had the lowest overall crime rate of any Australian state in 2020–2021, with 593 criminals per 100,000 residents. Another indication of how low and steadily dropping crime rates are in the ACT is the 23% year-over-year drop in the cases of illegal drug criminals that same year.
Yet, there are still occasional crimes in this area despite the changes. Violence was the primary offence perpetrated by 662 people or 30% of all criminals.
Additionally, according to the most recent information from the Canberra Police, there were 1,388 violent attacks, 947 break-ins, seven homicides, 1,948 incidents of destruction of property, 4,105 thefts, and 5,103 other offences in the nation’s capital during the first half of 2021, out of a count of 18,409 crimes and infractions.
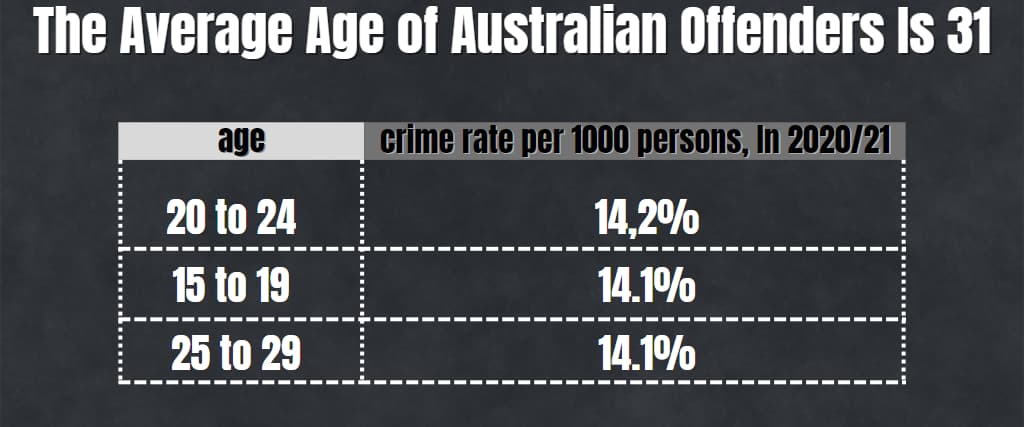
16. The Average Age of Australian Offenders Is 31
The most recent crime statistics show a decrease in crime in Australia among all age ranges between 2020 and 2021. In 2020/21, the crime rate amongst Aussies between the age of 20 to 24 was at 14,2% per 1000 persons. The crime rate was 14.1% amongst children aged 15 to 19 and 25 to 29.
17. 44,496 Juvenile Offenders Were Tried in Australia in 2020–21
Australia’s police department prosecuted nearly 44,000 juvenile offenders in 2020 and 2021. Good news: juvenile criminality in Australia is on the decline.
The teenage criminal rate has been falling steadily over the previous decade and is expected to drop to 1,785 per 100,000 people in 2020-21.
18. In 2020-21, 22% Of Juvenile Offenders Committed Injuries
Most juvenile offenders in Oz were between the ages of 10 and 17, with 9,856 perpetrating acts intending to cause injury in 2020-2021. Nearly all of them (96%!) involved physical violence.
Stealing came in second with 12% (5,212 criminals), and illegal drug-related offences made up 9% (4,088 violators).
As a bonus, the Australian Bureau of Statistics reports that the number of major robberies and extortion offences committed by minors fell by 20% between 2020 to 2021.
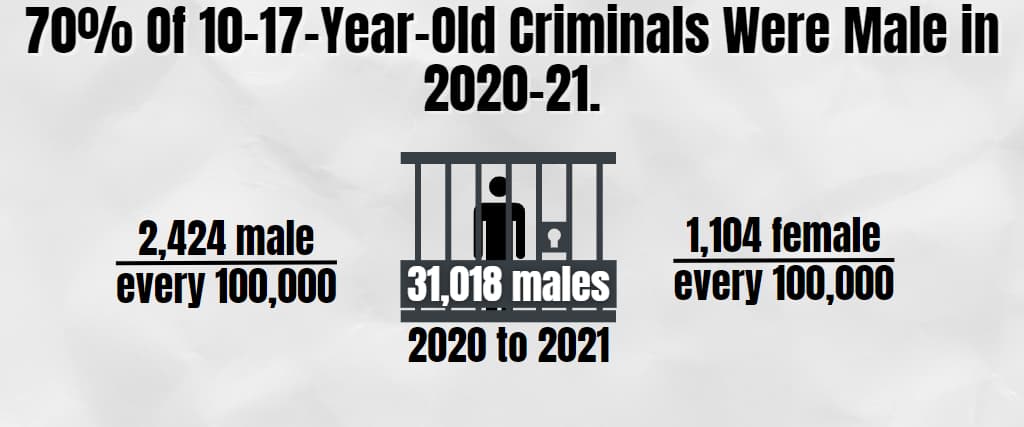
19. 70% Of 10-17-Year-Old Criminals Were Male in 2020-21.
The Australian Bureau of Statistics found that 31,018 males between 10 and 17 committed crimes in Australia from 2020 to 2021. Hence, the rate of juvenile male offenders was significantly higher than that of juvenile female offenders. For every 100,000 persons, there were 2,424 male criminals and just 1,104 female criminals.
20. 23% Of Australian Crimes in 2020-21 Were Intended to Injure.
In Australia, acts to cause injury topped the most commonly committed offences, accounting for 82,942 arrests in 2020–2021. Second, only to violent crimes that year, drug offences accounted for 17% or 62,698. In third place, at 11%, or 38,151 people, were public order offences.
21. In 2021, the NT Had the Highest Abuse Victim Rate, 3,682 per 100,000.
According to ABS crime stats, assault victimisation has increased significantly in various Australian states. Look at 2021 victim statistics in other territories and states below
| State | No. Victims per 100,000 |
| Western Australia | 1,986 |
| NSW | 790 |
| Tasmania | 658 |
| SA | 973 |
| ACT | 536 |
22. In 2021, Australia Recorded About 9,140 Robbery Victims.
According to the most up-to-date data on criminal activity in Australia, there were over 139,094 victims of break-ins with purposes in 2021. This is down significantly from the numbers reported in prior decades but up somewhat from the record low of 133,871 reported in 2020.
In addition, automobile burglary stats indicate that in 2021 there were 49,742 hijacked motor cars in Australia, approximately half the figures recorded in 1993 due to the rise in car ownership. In 2001, the number of Australians affected by this crime reached a record high of 139,895.
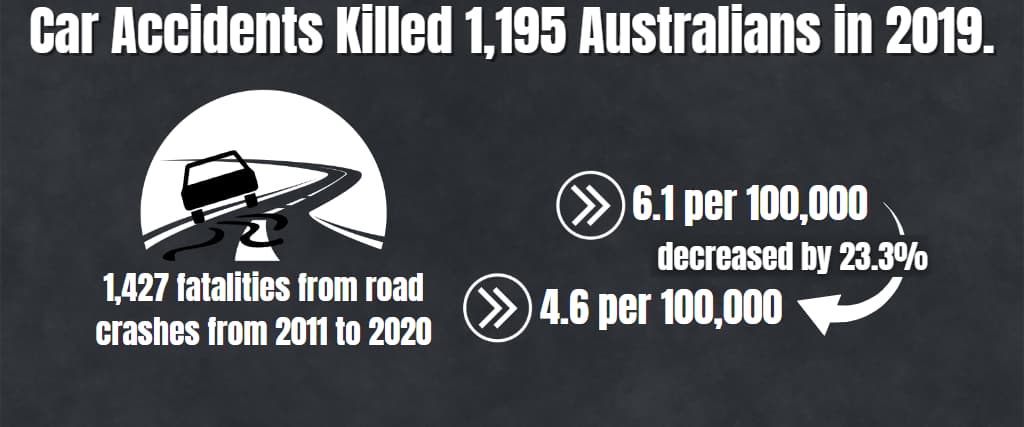
23. Car Accidents Killed 1,195 Australians in 2019.
This was lower than the benchmark of 1,427 fatalities from road crashes from 2011 to 2020, despite a 5.3% rise from the prior year. The yearly fatality rate decreased by 23.3%, or 6.1 per 100,000 people in the 2010–19 decade, to 4.7 people.
24. In Australia, There Were 1.4 Murder Victims per 100,000 People in 2021
Crime-related programs would have you assume that murders occur frequently. According to Oz crime stats, if demographic fluctuations are considered, homicide victims fell from approximately 4 per 100,000 persons in the last three decades between 1993 and 2023 by up to 50%.
25. In 2019–20, There Were 1.02 Homicides per 100,000 Australians.
In Australia, 0.78 murders per 100,000 persons nationally in 2017–18 was the lowest homicide rate ever recorded. Nonetheless, it increased little by 0.14 during that period and from 2018 to 2020.
26. Someone kills most Murder Victims in Oz They Know.
According to official crime statistics, 358 family and domestic abuse offenders were prosecuted countrywide in 2019 and 2020 per 100,000 persons, or 22% of all criminals. The fact that physical and mental violence are already factors in 7.4% of divorces appears telling.
Just 0.18 incidents out of 100,000 included strangers committing homicides as a whole.
27. In Australia, murder victims decreased by 26 from 2020 to 2021.
In particular, there were 396 murder victims in 2020 and 370 in 2021. 63% of occurrences in 2021 took place in a home, killing 232 people, while 61% used a knife or other weapon and left 225 people dead. 30% of the instances involved FDV, and 70% of the sufferers were men.
28. In 2020–21, the AU Police Found 80,496 People Guilty of Family and Domestic Violence.
Police crime records show that 358 domestic and family abuse perpetrators were prosecuted countrywide in 2019/20 per 100,000 persons, or 22% of all criminals. The fact that physical and mental violence are already factors in 7.4% of divorces appears telling.
29. 81% Of Those Who Committed Acts of Domestic and Family Abuse in 2020–21 Were Men.
According to the ABS crime figures, men made up little over four out of every five perpetrators of domestic abuse in 2020–21. There were four times as many male FDV offenders in Australia as females.
30. Fdv Was a Factor in 28% Of Killings and Other Crimes in 2021.
When you look at the details of the homicide rate in Oz, you will discover that, alarmingly, the number of killings due to domestic and family violence has reduced by 9% between the years 2020/21. One hundred forty-five victims were reported in 2020, compared to 105 in 2021.
31. Nsw Noted a Decline in Fdv Victims of Abuse in 2020–21.
Assault data in Australia show that, except in the Northern Territory, the number of attack victims involving family and domestic abuse decreased between 2020/21. Of the 63% or 5733 casualties, 63% of the attacks involved FDV.
There are 32% of these victims in NSW.
- Attack victims in Western Australia increased by 25% due to FDV.
- Moreover, a 40% increase in FDV-related victims of abuse in SA.
- FDV-related assaults affected up to 45% of victims in Tasmania.
- 42% of victims of abuse in the ACT were FDV victims.
32. Over 160 Cybercrimes per Day Were Reported by Australians in 2020.
In 2020, Australian individuals reported 60,000 crimes to the Australian Cyber Security Centre, 40% being fraud-related. They have to do with relationships, investments, and shopping. This comes as no surprise, given that the growth of eCommerce is expected to continue.
According to figures on cybercrime attacks, Australians lost $634 million to similar online frauds a year ago. However, this is only a preliminary estimate, as many of these offences go undetected.
33. The Card Fraud Rate in Australia Was 58.3 Cents for Every 1,000 Aud in 2020.
The Australian fraud rate fluctuated over the nine years from 2012 to 2020. In 2012, it was 43.6 cents for every 1,000 AUD, the lowest ever. In the subsequent decades, it grew until it peaked in 2017 at 75 cents for every $1,000. After that, it declined to less than 59 cents for every $1,000 in 2020.
Data on credit card use show that there were 4.2 m card crimes in Australia in 2021, most of which were bank accounts.
34. In Australia, Identity Crime Has a Yearly Economic Cost of Almost $2 Billion.
A study by the AIC found that 25% of Australians had at some time during their lives experienced identity theft. According to these internet crime data, 12% of them had their details misused in 2018–2019. Identity fraud, which costs the state almost $36 billion annually, is one of the leading facilitators of criminal organisations.
According to the most recent scam figures, Australians suffered significant losses (over $178 million) due to Ponzi schemes in 2021.
35. According to estimates, cybercrime damages Australian firms $29 billion annually.
The typical organisation can lose up to $276,323 per breach, as per Australia’s 2020 cyber figures, with 53% going for detection and remediation. Moreover, the average time to stop a ransomware assault is 51 days.
36. Australia’s criminal courts convicted 508,748 offenders in 2020–2021.
In 2020–2021, there were 8% more convicted defendants than the year before (469,204). According to ABS crime stats, in 2020/21, 449,387 defendants—or 97% of them—were found guilty; 38,718, or 8%—had all charges withdrawn; 17,213, or 4%—were moved to different court levels; and only 14,048, or 3%—were proven innocent.
37. In 2020–2021, 178,585 Individuals Were Charged With Traffic and Vehicle-Related Offences.
According to crime data for Australia from 2020–2021, just five categories accounted for 75% of the defendants’ major offences that were resolved in court.
With 35% of the aggregate, traffic and vehicle regulation offences came in first. Following that were assault and other acts meant to cause harm, accounting for 70,256 offenders, or 14% of all offenders.
Forty-nine thousand seven hundred forty-two convicts (12%) committed theft, compared to 55,973 who committed illicit drug crimes. Offences against the law came in last, accounting for 36,664 offenders or 8% of the entire.
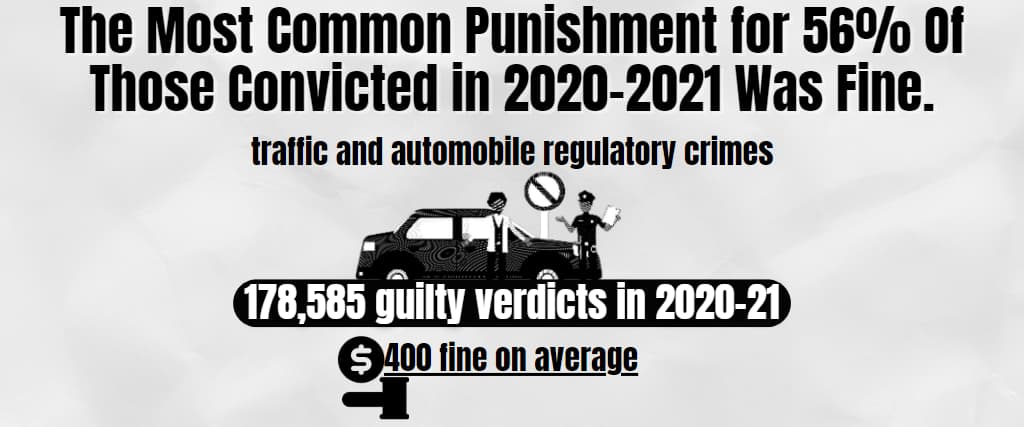
38. The Most Common Punishment for 56% Of Those Convicted in 2020–2021 Was Fine.
According to the pertinent crime stats, traffic and automobile regulatory crimes received the most significant sentences out of 178,585 guilty verdicts in 2020–21. They were required to pay a $400 fine on average.
39. In 2020–2021, 15,894 Defendants Had Their Cases Concluded in Higher Courts.
Eleven thousand four hundred thirty-six were convicted, 1,922 had the prosecutors dismiss their charges, 937 received acquittals, and 196 had their cases moved to different courts.
The number of defendants sentenced in Higher Courts in 2020/21 increased by 8% compared to the ABS crime figures for 2019/20.
40. In the 2020–2021 Court Year, 468,349 Offenders Had Their Cases Concluded.
In 2020–21, this figure grew by 24,572, a 9% rise from 2019–20. Of the 449,387 offenders found guilty, 43,717 had their cases dismissed by the prosecution, while 14,048 were found not guilty.
41. The Children’s Courts Adjudicated 24,506 Defendants in 2020–2021
In 2018/19, 30,178 offenders were sentenced in Children’s Courts, per statistics on the conviction of minor crimes in Australia. The number fell by 16% the following year. Out of the overall, 19,082 were convicted or entered pleas of guilty, 3,171 had the prosecutors withdraw their cases, 1,050 had their cases moved to other court levels, and 991 were declared not guilty.
42. Australia Had 42,970 Convicts as of June 30, 2020, and June 30, 2021
The number of convicts in Australia increased by 1,910 over the following year compared to the 12 months from June 30, 2019, to June 30, 2020, when it decreased by 5% to 41,060.
In addition, the national prison population in 2020/21 increased by 5% from 202 for every 100,000 individuals the previous year to 214 inmates.
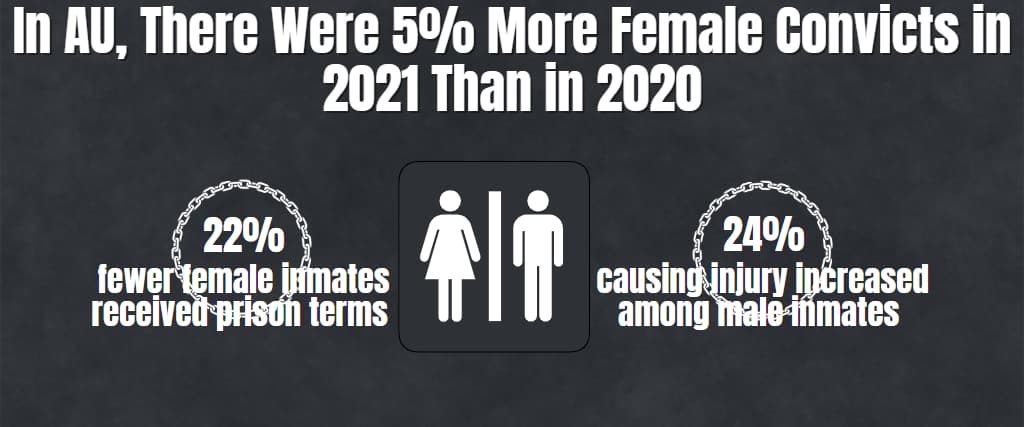
43. In AU, There Were 5% More Female Convicts in 2021 Than in 2020
Also, there were 5% more male inmates overall. Acts designed to cause harm were the most frequent offences in Australia for which fewer female inmates received prison terms (22%), whereas acts aimed at causing injury increased among male inmates (24%).
44. 8% More Aboriginal Islanders Were Convicted in 2020–21
When we examine the racial breakdown of criminality in Australia, we find that 13,039 Aboriginal Islander people were incarcerated in 2021, an increase from the previous year. Only two categories—theft by 21.3% and trespassing by 5.9%—saw a decrease in the number of such inmates in 2020.
45. 387 in Q1 2021, There Were Inmates in Community-Based Prisons for Every 100,000 Adults
CBC had 77,529 inmates as of the Q1 of 2021. This represented a substantial 7% year-over-year rise, given the figure was 83,377 in the same quarter last year.
Conclusion
While you may not be able to predict which crimes may rise in frequency in the future, you do know that overall crime rates have fallen in recent years for most offences. So, you can rest easy knowing that Australia is generally a secure place to live because we have all the necessary crime statistics. (Except for that annoying wildlife, but by now, isn’t anyone used to it?)